The marketing efficiency ratio (MER) is your total revenue divided by your total marketing spend over the same period. It tells you how many dollars of revenue your business brings in for every dollar you put into marketing, across every channel at once.
Platform dashboards tell you how each campaign claims to perform. MER tells you what the business actually got, and it can be improved from a direction most brands overlook: the cost side.
Key Takeaways
- MER = total revenue ÷ total marketing spend for the same period.
- MER is a blended, business-level metric. ROAS is a channel- or campaign-level metric. You need both.
- A “good” MER depends on your margins. Your breakeven MER is 1 ÷ your contribution margin.
- MER rises when revenue grows faster than spend, or when you pay less for the same marketing.
- Cash back on ad spend and recovered invalid traffic credits can reduce net marketing costs, improving overall efficiency without requiring changes to existing campaigns.
What Is the Marketing Efficiency Ratio (MER)?
MER measures the overall efficiency of your marketing. Most ad metrics start from the platform’s point of view. Meta reports the purchases it believes its ads drove, and Google does the same. Each one uses its own attribution model and window, and neither can see what the other touched.
So when a customer clicks a Meta ad on Monday, searches your brand on Google on Thursday, and buys, both platforms can report that purchase as their conversion. That’s why when you add up your platform dashboards, the total attributed revenue often exceeds what your store actually made.
MER helps avoid the discrepancies that arise from platform-level attribution. By comparing total business revenue against total marketing spend, it provides a broader view of marketing efficiency without relying on individual platforms’ conversion claims. Meta and Google can both claim the same sale, but your Shopify revenue only counts it once.
The MER Formula
MER = Total Revenue ÷ Total Marketing Spend
Use the same time window for both numbers, typically a week, month, or quarter.
MER Example
Say your store does $500,000 in revenue in a month. You spend $100,000 on Meta and Google ads and another $25,000 on agency fees, creative, and marketing software, for $125,000 in total marketing spend.
$500,000 ÷ $125,000 = an MER of 4.0, or $4 in revenue for every $1 in marketing.
What Counts as Total Marketing Spend?
The most common way MER goes wrong is an incomplete denominator. So you’ll need to decide what you include, write it down, and keep it consistent.
| Include | Usually exclude |
|---|---|
| Paid media (Meta, Google, TikTok, Amazon, etc.) | Cost of goods sold |
| Agency and freelancer fees | Shipping and fulfillment costs |
| Creative production and UGC | Customer service salaries |
| Influencer and affiliate payouts | General overhead (rent, finance, ops tools) |
| Marketing software and tools | Discounts (track separately; they reduce revenue) |
| Marketing team salaries (if you use “fully loaded” MER) |
Many teams track a media MER (paid media only) weekly and a fully loaded MER (all marketing costs) monthly.
What Is a Good Marketing Efficiency Ratio?
There’s no universal target. An MER of 3.0 may be highly profitable for a brand with 70% margins but unprofitable for one with 25% margins. The number that matters is your breakeven MER:
Breakeven MER = 1 ÷ Contribution Margin (before marketing)
| Contribution margin before marketing | Breakeven MER | What it means |
|---|---|---|
| 60% | 1.67 | Every $1 of marketing must return at least $1.67 in revenue |
| 50% | 2.0 | Every $1 of marketing must return at least $2.00 |
| 40% | 2.5 | Every $1 of marketing must return at least $2.50 |
| 30% | 3.33 | Every $1 of marketing must return at least $3.33 |
| 25% | 4.0 | Every $1 of marketing must return at least $4.00 |
Anything below breakeven means you’re buying revenue at a loss. Anything comfortably above it can create room to scale.
How Is MER Different from ROAS?
Return on ad spend (ROAS) divides revenue attributed to a campaign or channel by that campaign’s ad spend. MER divides all revenue by all marketing spend.
| MER | ROAS | |
|---|---|---|
| Scope | Whole business, all channels | One campaign, ad set, or channel |
| Revenue source | Store or accounting revenue | Platform-attributed conversions |
| Cost input | All marketing spend | Ad spend on that channel only |
| Affected by attribution gaps? | No | Yes, often heavily |
| Best for | Budget decisions, CFO reporting, scaling calls | Creative tests, bid changes, channel tuning |
| Weakness | Can’t tell you which channel is working | Can double-count sales and over-credit the platform |
Use ROAS to steer campaigns and MER to check whether that steering is making the business more money. When platform ROAS climbs but MER stays flat, it may indicate the platforms are claiming credit for sales that would have happened anyway.
A note on definitions: some analytics tools flip the ratio and show marketing spend ÷ revenue (a cost percentage). A “0.25” in that format is the same as a 4.0 MER. Check which version your dashboard uses before comparing numbers across tools.
The Growing Importance of MER
MER has is an increasingly useful metric because:
- Attribution got worse. Privacy changes on iOS and browsers cut the tracking signals that platforms rely on.
- Finance wants one number. MER answers the question that matters: should we spend more or less on marketing?
What Makes MER Rise or Fall?
Since MER is a ratio, it moves when either side moves. Most advice focuses only on revenue. The cost side is an effective way to optimize and requires little to no change to campaigns.
| Driver | Side of the ratio | Effect on MER |
|---|---|---|
| Higher conversion rate on the site | Revenue | Up. More revenue from the same traffic |
| Strong repeat purchase/retention | Revenue | Up. Revenue that needs little new spend |
| Scaling spend into weaker audiences | Cost | Down. Diminishing returns on each new dollar |
| Rising CPMs and CPCs | Cost | Down. Same traffic costs more |
| Paying for invalid traffic (bots, fake clicks) | Cost | Down. Spend with zero chance of converting |
| Cash back and credits on ad spend | Cost | Up. Lower net cost for the same media |
The Cost Side of MER: What You Actually Pay for Marketing
Most MER calculations use the gross ad platform invoice. But the invoice isn’t your true cost. Two things change what you actually pay: money you get back, and money you never should have spent.
Cash Back on Ad Spend
If you pay for ads on a card that gives you cash back on your ad spend, part of every dollar comes back to you. At 3% back on $100,000 a month in Meta and Google spend, that’s $3,000 a month, or $36,000 a year, returned on spend you were making anyway. (Here’s how cash back on ad spend works.)
How you pay matters too. Meta has been moving some of its largest advertisers toward invoiced billing, which can cut them off from card rewards entirely. That shift has some brands rethinking their spend.
Invalid Traffic: Paying for Clicks That Could Never Convert
Invalid traffic (IVT) refers to ad interactions that do not meet established standards for valid human engagement. This can include:
- Bots
- Click farms
- Fake views
- Accidental or duplicate clicks
The industry splits it into general invalid traffic (GIVT), such as known crawlers and data-center traffic, and sophisticated invalid traffic (SIVT), which is built to look human. (The Media Rating Council sets these definitions in its invalid traffic guidelines.)
Invalid traffic hurts MER twice:
- It inflates the denominator. You pay for clicks that have zero chance of becoming revenue. Fake engagement from viewbots and Instagram bots is pure cost.
- It degrades the numerator over time. Ad algorithms optimize toward whatever “converts” or engages. Invalid engagement signals can also interfere with campaign optimization. When these signals are not adequately filtered, platforms may make targeting and delivery decisions based on misleading data, potentially increasing acquisition costs over time.
Google filters much of this automatically and credits some invalid traffic it catches after billing, per its invalid traffic policy. But platforms don’t catch everything. And despite Google automatically filtering for much of this traffic, missed traffic can still go uncredited.
Gross MER vs. Net MER
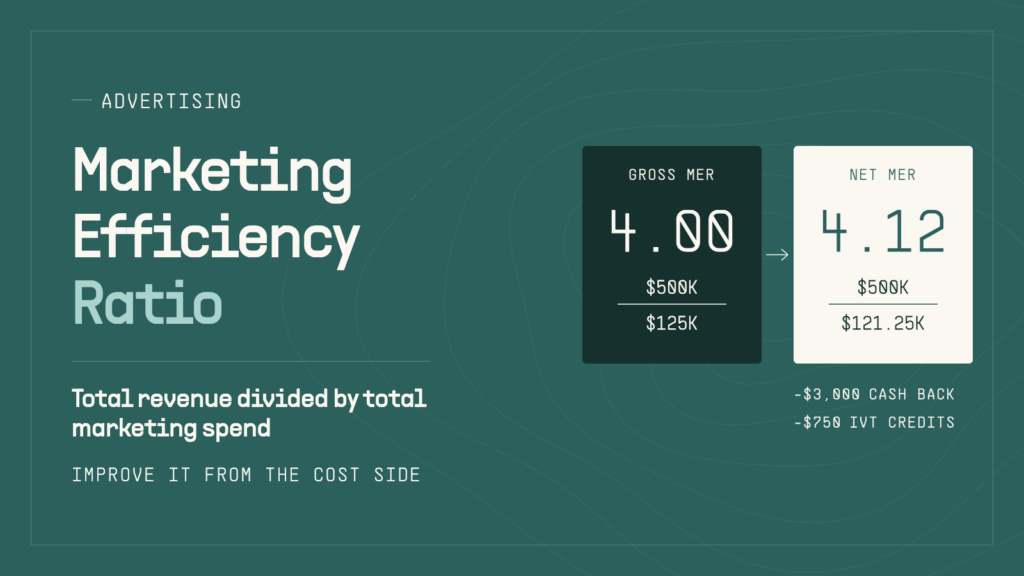
To see the cost side clearly, you’ll want to track two versions of MER side by side. Gross MER uses invoiced marketing spend. Net MER subtracts cash back and recovered credits from that spend. Using the earlier hypothetical example:
| Gross MER | Net MER | |
|---|---|---|
| Revenue | $500,000 | $500,000 |
| Total marketing spend (invoiced) | $125,000 | $125,000 |
| Less: 3% cash back on $100,000 ad spend | — | −$3,000 |
| Less: invalid traffic credits recovered (0.75% of ad spend) | — | −$750 |
| Net marketing cost | $125,000 | $121,250 |
| MER | 4.00 | 4.12 |
That lift comes without changing a single campaign. It also excludes the bigger long-term gain: cleaner signals to improve quality of data yielding more effective optimizations.
Common Mistakes to Avoid When Tracking MER
- Leaving costs out of the denominator. Counting only ad spend while ignoring agency fees, creative, and tools makes MER look better than it is in reality.
- Mismatched time windows. Revenue and spend must cover the same period.
- Celebrating MER while revenue shrinks. Cutting spend can raise MER in the short term. If revenue is falling, a higher MER may just mean you’re shrinking efficiently.
- Ignoring new vs. returning customers. A strong repeat customer base can prop up MER while new customer acquisition quietly gets more expensive. Track new-customer MER separately.
- Treating the invoice as your true cost. Ignoring invalid traffic and cash back misstates what marketing actually costs.
Actionable Strategies to Improve Your Marketing Efficiency
On the Revenue Side
- Fix the conversion rate before adding spend. Better landing pages and offers raise revenue from traffic you already pay for.
- Raise your average order value with bundles, free-shipping thresholds, and upsells.
- Invest in retention. Email, SMS, and loyalty generate revenue with little added media cost.
- Scale in steps and watch MER at each step to find where diminishing returns start.
On the Cost Side
- Audit spend, not just performance. Performance audits ask which ads work. Spend audits ask whether you’re paying for traffic that was never real. (See the difference between the two.)
- Reduce invalid traffic at the source. Build exclusion and suppression lists from known bad traffic, so platforms stop serving it.
- Claim the credits you’re owed. Review invalid activity credits in your ad accounts and file for the invalid traffic that the platforms missed.
- Earn back a percentage of every ad dollar. Paying for ads with a card that offers cash back on ad spend lowers the net cost on every campaign at once.
- Report gross and net MER together. Showing both makes the cost-side gains visible to your team and your finance lead.
Frequently Asked Questions
How do you calculate marketing efficiency ratio?
Divide your total revenue by your total marketing spend for the same period. $400,000 in revenue on $100,000 in marketing spend is an MER of 4.0.
Is MER the same as blended ROAS?
They’re close. Blended ROAS usually divides total revenue by total ad spend only. MER often uses all marketing costs, including agencies, creative, and tools, but many teams use the terms interchangeably, so make sure to define yours and keep those terms consistent.
Is a higher MER always better?
Not always. A very high MER can mean you’re underspending and leaving growth on the table, so aim for the most revenue you can get while staying above breakeven MER.
Does click fraud affect MER?
Yes. Every invalid click you pay for adds cost with no chance of revenue, which lowers MER directly. Over time, bot signals also degrade platform targeting, which raises CPA and lowers MER further.
Improve Your MER From the Cost Side
Dash.fi helps ecommerce brands lower what they actually pay for advertising. The Dash.fi card offers cash back on Meta and Google ad spend, and Dash.fi’s ad audit identifies invalid traffic in your billing and click data, prepares documentation for ad credit requests, and turns findings into exclusion audiences to help reduce future wasted spend. Together, these tools can lower net marketing costs and improve MER.