Cash flow forecasting is the process of estimating how much cash will come into and go out of your business over a set future period, usually week by week, so you can see your cash position before you get there. For ecommerce brands, the forecast has to handle something most generic templates ignore: cash doesn’t move in a straight line.
Ad spend climbs in October. Carriers layer on peak surcharges in November and December. Refunds land in January, after your holiday revenue has already been spent. If your forecast treats every month the same, you’ll find out about your tightest cash week when you’re already in it.
In this guide, we’ll walk you through how to build a cash flow forecast that accounts for seasonal swings, including a 13-week rolling view, scenario planning, and tracking card spend by payment date instead of transaction date.
What Is Cash Flow Forecasting?
A cash flow forecast projects your future cash receipts and cash disbursements to estimate your ending cash balance for each period. It’s different from a P&L. Your P&L records revenue when it’s earned and expenses when they’re incurred. Your cash flow forecast tracks when money actually hits or leaves your bank account.
For ecommerce, that gap is where the trouble lives. A record BFCM weekend looks great on the P&L, but processor and marketplace payouts land on their own schedules, November’s Meta bill sits on a card statement due weeks later, and a share of holiday orders comes back as refunds in January.
Cash Flow Forecasting vs. Cash Positioning vs. Budgeting
These terms overlap, but they answer different questions.
| Term | Question it answers | Time horizon | Basis |
|---|---|---|---|
| Cash positioning | How much cash do you have right now, across every account and payout balance, and what’s already committed? | Today | Actual balances |
| Cash flow forecasting | What will your cash balance be at the end of each week or month ahead? | 13 weeks to 12 months | Cash (when money moves) |
| Cash forecasting | Often used as a synonym for cash flow forecasting; sometimes refers only to projecting the ending balance | Varies | Cash |
| Budgeting | What do you plan to earn and spend this year? | Annual | Usually accrual (when revenue and costs are recognized) |
Cash positioning is your starting line, and every forecast update should begin from a verified cash position.
Why Ecommerce Cash Flow Is Seasonal
Most ecommerce brands spend cash for peak season months before the revenue arrives, then pay for part of it again in January:
| Period | Cash event | Direction | What to forecast |
|---|---|---|---|
| Jul–Sep | Inventory deposits and balances for Q4 stock | Out | PO payment dates by supplier terms, not ship dates |
| Oct | Ad spend ramps as CPMs rise | Out (via card) | The card payment date, not the day the ads ran |
| Oct–Jan | Peak and demand surcharges on parcels | Out | Weekly carrier invoices with surcharges layered on by week |
| Nov–Dec | BFCM and holiday sales | In | Payout dates by channel, net of fees and reserves |
| Dec–Jan | Card statements for November ad spend come due | Out | Your largest single outflow may land here |
| Jan–Feb | Returns, refunds, and return labels | Out | Refunds by week using your historical return rate |
| Jan | Sales tax remittances on holiday sales | Out | Filing deadlines by state |
Cash goes out early for inventory and ad ramps, comes in during November and December, then goes back out in January as card statements, refunds, and tax payments stack up. A brand can post its best revenue quarter and still hit its lowest cash balance in mid-January.
Q4 ad costs also can run over plan. CPMs climb, and invalid traffic from click farms rises during the holidays, inflating outflows without adding revenue.
How to Build a 13-Week Cash Flow Forecast
A 13-week cash flow forecast covers one quarter at weekly granularity. It’s short enough to stay accurate and long enough to see across peak season. For Q4, anchor the window so that it ends in late January.
A window starting in late October captures the full peak cycle, including returns.
- Start from a verified cash position. Add every bank account plus pending processor and marketplace payouts. Subtract outstanding checks and scheduled ACH payments.
- Forecast receipts by payout date, not order date. Break out each channel. Net out fees, rolling reserves, and expected chargebacks.
- Map ad spend to the date cash leaves your account. If Meta and Google bill to a card, the outflow happens when you pay the statement, not when the ads run (more on this below).
- Forecast shipping with surcharges layered on by week. Multiply base cost per order by projected orders, then add peak surcharges for the weeks each carrier applies them.
- Schedule inventory payments by PO terms. Include deposits, balances due on shipment, freight, and duties.
- Layer in returns and refunds. Use your own historical return rate by product category. If you don’t have one, retailers surveyed by the National Retail Federation expect about 17% of holiday sales to be returned. Returns after BFCM carry costs beyond the refund itself, including labels.
- Add fixed and scheduled costs. Payroll, rent, software, loan payments, and sales tax remittances. Sales tax collected on holiday orders is often remitted in December and January, depending on your filing frequency.
- Calculate ending cash for each week and set a minimum threshold. Decide in advance what balance triggers action, such as slowing a campaign, delaying a PO, or drawing on a credit line.
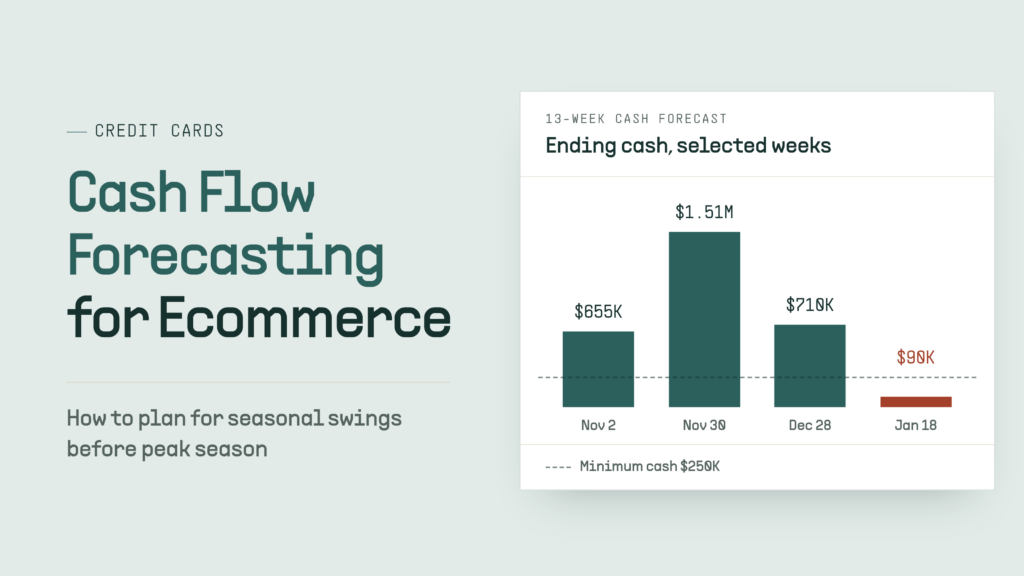
Here’s what a few selected weeks might look like for a brand spending heavily on paid social (illustrative figures):
| Week of | Starting cash | Receipts | Ad spend (card) | Shipping | Inventory | Refunds | Other | Ending cash |
|---|---|---|---|---|---|---|---|---|
| Nov 2 | $850K | $410K | $280K | $60K | $150K | $25K | $90K | $655K |
| Nov 30 | $640K | $1.15M | $0 | $140K | $0 | $45K | $95K | $1.51M |
| Dec 28 | $1.32M | $520K | $610K | $110K | $200K | $90K | $120K | $710K |
| Jan 18 | $780K | $180K | $450K | $70K | $0 | $210K | $140K | $90K |
The January week is the one to watch. Your revenue has slowed, December’s card statement is due, refunds peak, and sales tax lands in the same window. With a $250K minimum threshold, this brand needs to act weeks earlier.
Track Card Spend by Payment Date, Not Transaction Date
A common forecasting error in ecommerce is treating card spend as cash out on the day of the transaction. Every card charge has three dates, and only one of them moves cash:
| Date | What happens | Cash impact |
|---|---|---|
| Transaction date | The ad platform or carrier charges your card | None yet |
| Statement close date | Charges roll into a statement balance | None yet |
| Payment due date | You pay the statement | Cash leaves your account |
November ad spend on a card with a monthly statement hits cash in December or January, after holiday payouts arrive. The same spend on a card that settles daily leaves the next day, during your heaviest outflow period. That makes payment terms a forecasting lever.
Here’s what to track:
- Statement cycles and due dates for every card that carries ad, shipping, or inventory spend
- Credit limits as a constraint. If your limit caps out mid-BFCM, campaigns stop. Limits that scale with business performance matter more in Q4 than any other quarter.
- Cash back as a receipt. Rewards on ad and shipping spend are cash coming back in, so forecast them in the period they post.
- Leakage in outflows. Billing errors on ad and carrier invoices inflate your outflow lines. Recovered credits and refunds belong in your receipts forecast.
Scenario Planning for Peak Season
A single forecast gives you one answer. Scenario planning shows you the range. Build three versions of your 13-week cash flow forecast and change only the drivers that actually move during peak:
| Driver | Downside | Base | Upside |
|---|---|---|---|
| Revenue vs. plan | -20% | Plan | +25% |
| Marketing efficiency ratio | Falls as CPMs rise | Holds at last year’s Q4 level | Improves |
| Ad spend | Committed budgets run regardless | Plan | Scaled up to chase demand |
| Return rate | Plus 5 points | Historical average | Historical average on higher volume |
| Shipping cost per order | Higher surcharge exposure | Plan | More orders in surcharge weeks |
| Inventory | Excess stock, cash tied up | Sells through on plan | Early reorder needed |
Here’s what many brands miss: the upside case can be the tightest on cash. Higher sales pull more ad spend, surcharges, earlier reorders, January returns, and sales tax, while payouts lag.
Stress-test each scenario:
- What happens if your card limit isn’t increased before BFCM?
- What happens if a processor or marketplace holds a reserve on your payouts?
- What happens if your return rate rises five points in January?
Why Is Cash Flow Forecasting Valuable?
Cash flow forecasting gives you the lead time you need to act before a low balance leaves you short on operating funds.
Specifically, it allows your company to:
- Set ad budgets based on cash you’ll actually have as opposed to revenue you’ve booked
- Time inventory purchases and negotiate supplier terms around your cash cycle
- Decide when to draw on credit, and how much, before you need it urgently
- Avoid pausing campaigns during peak demand because a card limit or cash balance ran out
- Give lenders, investors, and your board a credible view of liquidity
Best Practices for Ecommerce Cash Flow Forecasting
- Update weekly and track variance. A forecast loses accuracy the further out it goes, so compare last week’s forecast to actuals and adjust the drivers that missed.
- Use unadjusted data for seasonality. Seasonally adjusted figures smooth out the swings you’re trying to plan for. The U.S. Census Bureau’s quarterly e-commerce sales data, not seasonally adjusted, shows the Q4 spike clearly year after year. Your own history works the same way.
- Separate every payout channel. Processor, marketplace, wholesale, and BNPL payouts each run on different schedules.
- Build your peak forecast by September. By October, inventory and ad commitments are already locked.
Frequently Asked Questions
What is cash forecasting?
Cash forecasting is estimating your future cash balance by projecting expected receipts and payments over a defined period. In practice, it’s used interchangeably with cash flow forecasting.
Can small businesses benefit from cash flow forecasting?
Yes, often more so than larger ones. Smaller ecommerce brands usually have thinner cash buffers, so a single mistimed inventory payment or January refund spike can create a shortfall. A simple 13-week spreadsheet updated weekly is enough to start.
How far out should an ecommerce cash flow forecast go?
Use a rolling 13-week forecast for operating decisions and a 12-month monthly forecast for annual planning. Before peak season, make sure your 13-week window extends through January.
What’s the difference between the direct and indirect method?
The direct method forecasts actual cash receipts and payments line by line, which works best for short-term ecommerce forecasting. The indirect method starts from net income and adjusts for non-cash items and working capital changes, which is more common for longer-range planning.
Know Your Cash Position Before Peak Season, Not After
Seasonal swings are predictable. Brands that get caught short usually aren’t surprised by demand; they’re surprised by timing. Forecast when cash actually moves, run the upside case as seriously as the downside, and treat card terms and limits as part of your cash strategy.
The Dash.fi corporate card offers performance-based limits that grow with your business and lets you choose your payment terms. Pay sooner to earn more cash back on ad and shipping spend, or take up to 60 days to keep cash in the bank through January. Either way, your biggest peak-season costs work with your cash cycle instead of against it.