
Digital advertising is now one of the largest line items on a company’s P&L, and for e-commerce businesses, ad spend on platforms like Google and Meta can represent up to 40% of your total operating expenses. At that scale, teams can’t afford to treat advertising like a black box. This guide defines what ad spend is and outlines the questions to ask when measuring success.
What is Ad Spend?
Ad spend is the total amount a business pays to advertise across paid channels: Google Search and Shopping, Meta (Facebook and Instagram), TikTok, Amazon Ads, programmatic display, and any other platform where you pay for placement, clicks, or impressions.
Depending on how a company tracks it, ad spend can include:
- Media costs: what you pay platforms directly for impressions, clicks, or conversions
- Agency fees: if you pay a third party to manage campaigns
- Platform fees: software used to manage, automate, or report on campaigns
- Creative production costs: if you need someone to create the assets
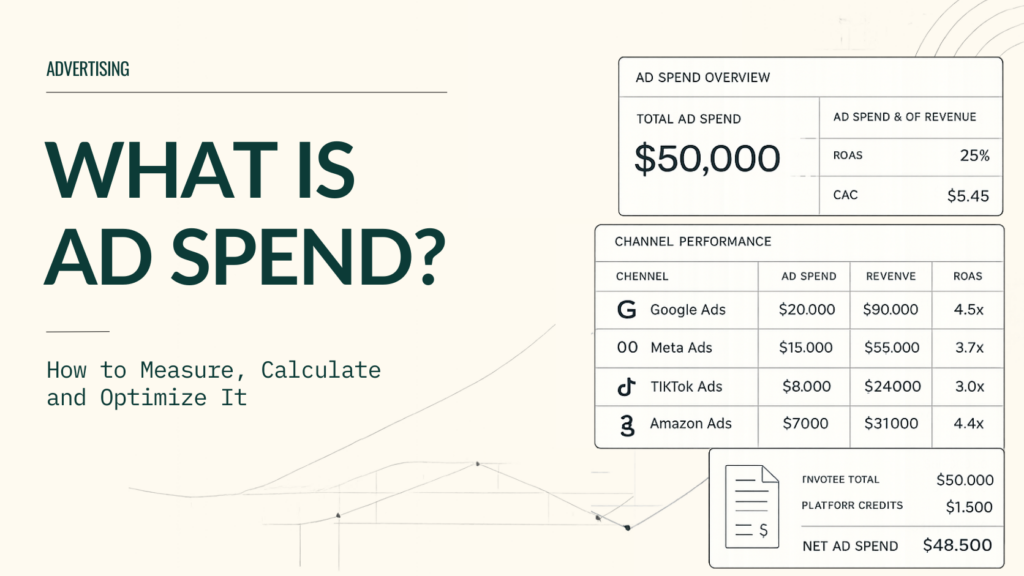
It’s worth clarifying the difference between gross ad spend and net ad spend. Gross spend is the full amount charged while net ad spend is the amount after any credits, refunds, or reimbursements for invalid traffic or billing errors. The gap between the two is often bigger than businesses realize.
How to Calculate Ad Spend
The raw number is simple to total up, but the ratios built on top of it are what make ad spend a useful management metric. The most common calculations are:
Total ad spend
Total ad spend = sum of all paid media costs across every channel for a given period
Ad spend as a percentage of revenue
Ad spend % of revenue = (Total ad spend ÷ Total revenue) × 100
Example: if you spent $50,000 on ads and generated $300,000 in revenue during the same period, your ad spend ratio is 16.7%. This is the most commonly cited benchmark because it’s easy to calculate and compare across companies.
Ad spend as a percentage of gross margin
Ad spend % of gross margin = (Total ad spend ÷ Gross margin) × 100
Finance teams often prefer this version because it ties advertising directly to profitability rather than top-line revenue. A campaign that drives high revenue but thin margin can still be a bad investment.
Customer acquisition cost (CAC)
CAC = Total ad spend ÷ Number of new customers acquired
CAC tells you what it actually costs, on average, to win one customer through paid channels. This is also useful for comparing against customer lifetime value (CLV) to see whether acquisition spend pays for itself over time.
What Is Return on Ad Spend (ROAS)?
Return on ad spend (ROAS) measures the revenue generated for every dollar spent on advertising. It’s the headline metric most marketing teams and ad platforms report.
ROAS = Revenue from ads ÷ Ad spend
Example: $20,000 in ad spend that generates $80,000 in attributed revenue is a 4x ROAS (every $1 spent returned $4 in revenue).
What Difference Does Data Make in Evaluating Ad Spend?
Marketers rely heavily on the data they get from the platforms they advertise on, which is often a conflict of interest, as ad platforms have an incentive to show favorable numbers.
It’s important to look beyond the ad platform to contextualize the data. Look for independent sources that can:
- Verify your actual spending against what you’re being invoiced
- Identify any discrepancies between the conversions your platforms are reporting and what actual revenue is coming in
- Flag anomalies in traffic quality that suggest you’re getting invalid clicks or ad fraud
- Provide breakdowns of what you’re spending in a way that maps to the appropriate accounting categories
The more granular and independent the data, the better the decisions you can make. This is why advertisers are starting to lean more heavily on third-party audit tools and spend visibility platforms. These help with evaluating advertising spending independent of platform-provided dashboards.
How Can Businesses Track the Effectiveness of Their Digital Ad Spend?
Tracking ad effectiveness requires both platform-level and independent measurement. A complete tracking framework will include:
- First-party conversion data: Revenue and order data from your own systems, not the ad platform’s attribution model.
- Third-party click audit tools: Independent verification of the quality of your traffic that platforms have little incentive to provide themselves.
- Billing reconciliation: Regular comparison of ad platform invoices against actual charges, looking for discrepancies and unauthorized spend.
- Contribution margin by channel: A finance-friendly metric that shows the net profitability of each advertising channel after variable costs.
- Cohort analysis: Tracking the long-term revenue generated by customers acquired through specific campaigns, beyond the immediate conversion window.
The Role of AI Tools for Ad Spend Optimization
AI is reshaping the way businesses buy advertising as well as how they audit that spending. The most relevant AI applications are the ones that can analyze billing data and surface waste. It’s a bonus if an app can also detect fraud.
Here are a few types of AI applications designed to focus on the finances behind ad spend:
- Automated billing audits that compare platform charges against click and conversion data
- Invalid traffic detection that identifies patterns consistent with bot activity or click fraud
- Spend anomaly alerts that flag unusual budget acceleration or unauthorized platform charges
- Automation of your suppression list to remove known bad traffic sources before they drain budgets
Using these tools appropriately allows you to shift the conversation from a reactive one, where you’re wondering why you overspent, to a proactive one, where you prevent overspending before it happens.
What Is a Good Level of Ad Spend?
There’s no one-size-fits-all answer, but there are useful benchmarks to be mindful of. Most e-commerce companies target an advertising-to-revenue ratio of 10-20%, though this can, of course, vary significantly by category, growth stage, and competitive environment.
| Business Stage | Typical Ad Spend % of Revenue | Finance Priority |
|---|---|---|
| Early-stage growth | 25–40% | Customer acquisition efficiency |
| Scaling | 15–25% | CPA reduction, ROAS improvement |
| Mature/profitable | 8–15% | Margin protection, spend efficiency |
| Market leader | 5–12% | Brand maintenance, waste reduction |
Many teams set the real ceiling as a percentage of gross margin rather than revenue, since this ties advertising directly to profitability. A good level of ad spend is one that will produce measurable returns you can count on for the long term, not just one that drives volume.
Consider these other questions to help calculate right level of ad spend:
- What is our actual return on marketing investment (ROMI) net of fees, waste, and fraud?
- How does advertising spend impact gross margin and overall profitability?
- What percentage of our ad budget is reaching real, convertible customers?
- Are we exposed to invalid traffic, click fraud, or billing errors from ad platforms?
- How do we benchmark our ad efficiency against industry peers?
- What’s the risk if we cut this budget by 20%?
How Can You Increase Efficiency While Reducing Ad Spend?
In the growing competitive landscape, one of the most important ad mandates is to reduce spending while maintaining growth. This means that marketing teams have to shift their focus from volume (the number of ads or clicks) to efficiency (the number of conversions).
Key strategies to help make this shift require marketers to:
- Audit for waste first. Before you cut a campaign, find out where the spending is lost to fraud, invalid traffic, or billing errors. Recovering that budget can be faster than trying to optimize your campaign.
- Clean up the ad account data. Every invalid click degrades the machine learning model, forcing your platform to optimize toward low-quality signals, until the algorithm is sending your ads to the entirely wrong audience. Removing bad traffic improves the efficiency of your target without increasing your spend.
- Align on shared KPIs. Establish metrics that everyone will track, like net customer acquisition and contribution margin per channel.
- Implement spend controls. Set hard budget caps and require approvals for any campaign scaling above agreed thresholds to prevent auto-bid tools from exceeding finance-approved budgets.
- Review platform billing regularly. Invoices from your ad platforms can include billing discrepancies that go unnoticed. A regular billing review process, or audit, can show you charges that you can recover.
Independent audit tools can make this process much less manual. For example, the dash.fi platform is designed specifically to address this issue, so teams can gain real visibility into advertising costs and payment data. Businesses can see their spending efficiency, in addition to where they may have the potential to recover dollars you’ve lost to click fraud or billing errors.
dash.fi’s Click Fraud Agent comes as a free feature with your corporate card for ad spend. It analyzes ad billing and click data to identify leakage, file credit requests with platforms on behalf of the business, and provide recommendations for suppression lists that will protect the quality of your ad account going forward.
Frequently Asked Questions
How much should a business spend on ads?
There’s no fixed rule, but most e-commerce businesses spend 10–20% of their projected revenue on advertising. The right level will depend on your growth stage, the category of competitiveness, and the profitability of your targets. Businesses will typically set a maximum ad spend as a percentage of gross margin to ensure their campaigns remain profitable.
What is the difference between ROAS and ROMI?
ROAS (return on ad spend) measures revenue generated per advertising dollar, as reported by the ad platform. ROMI (return on marketing investment) is a broader financial metric that accounts for all of your marketing costs and measures their actual profit contribution. Finance teams typically prefer ROMI because it reflects real business outcomes rather than platform-reported numbers.
Why do teams have multiple ways of viewing ad performance?
The core issue is attribution: different teams use different data sources. Marketers rely on platform dashboards, which tend to over-attribute conversions, while finance teams rely on actual revenue data, which often tells a more conservative story. To reduce this friction, it helps to collaborate on a shared, independent data source.
What is click fraud and why does it matter?
Click fraud is fake or low-quality clicks on ads that eat away at your ad budget without producing real customers. It degrades ad account performance by feeding bad signals to the platform’s AI, and requires active monitoring and mitigation.
How can e-commerce companies reduce ad spend waste?
Start with a billing and traffic audit to identify where your spend is being lost to invalid clicks or platform errors. Then implement suppression lists, establish budget caps, and align across teams on shared performance metrics that go beyond platform ROAS.